Published on 28th Mar 2023 –
Updated on 15th Aug 2025
Finding a safe road during an earthquake is very crucial for
civilians.
When snow sweeps across the country, the online world for
education providers take a pretty big hit. It doesn’t seem
obvious at first, why would it?
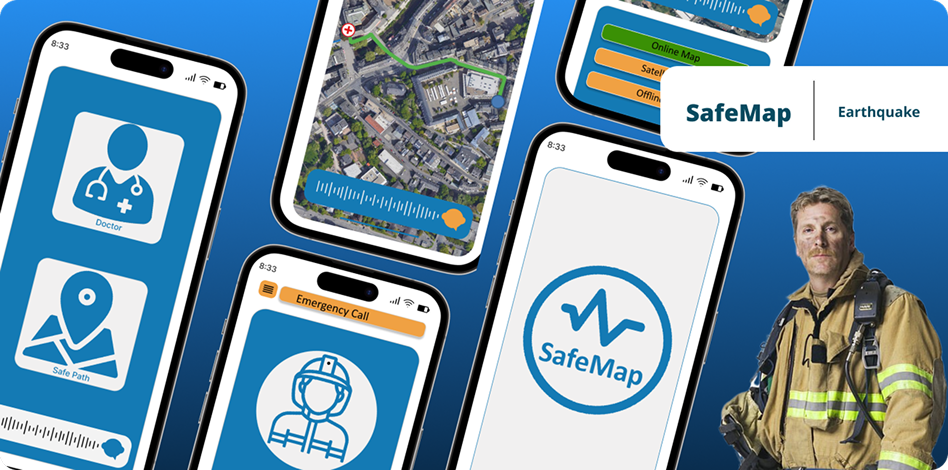
Safemap navigation
Designing routing systems for earthquakes requires frontend
usability studies and backend algorithm modifications.
Evaluations from subject-matter experts can enhance the design
of both the front-end interface and the back-end algorithm of
urban artificial intelligence (AI). Urban AI applications need
to be trustworthy, responsible, and reliable against
earthquakes, by assisting civilians to identify safe and fast
routes to safe areas or health support stations. However, routes
may become dangerous or obstructed as regular routing
applications may fail to adapt responsively to city destruction
caused by earthquakes.
In everyday scenarios, we rely on routing applications like
Google Maps for navigation, gradually leaning on our spatial
memories as we familiarize ourselves with recommended routes.
However, during earthquakes, these applications may fall
short, lacking optimization to guide civilians to safe routes,
especially when roads are rendered inaccessible by
destruction. In such urgent and stressful earthquake
situations, citizens seek refuge in shelters, hospitals, and
open spaces. Relying on regular routing applications poses
risks to individual navigation in earthquakes, as these
applications are designed to operate under normal conditions,
focusing on the shortest routes without considering the impact
of seismic destruction on the city. Routes can become
impassable due to earthquake-induced damage on city
infrastructure, and thus the risk of following collapses or
aftershocks remains elevated if civilians attempt to traverse
them. A routing system designed to respond to earthquakes can
enhance the disaster resilience of cities and urban areas. In
the field of Urban AI, the integration of both frontend user
experience design and backend algorithm modification can
address the complex challenges faced by cities from studies in
urban science, spatial computation, user experience, and
artificial intelligence. In this context, our research
question is: How can a routing system be designed for
earthquake scenarios that integrate algorithm modification and
user interface design effectively?
To comprehend the subject of routing systems for earthquakes, it is crucial to involve subject matter experts in the design of such systems. These include urbanists, who analyze the earthquake impact on the city; UX designers, who assess user experience in utilizing mobile routing applications; quake survivors, who offer insights and experiences regarding human behavior and safety during earthquakes; and first responders, who provide perspectives on delivering medical support and emergency rescue to civilians during seismic events. By collaborating with these subject matter experts, we can iteratively refine the design of the routing application, and modify algorithms that are apt for earthquake scenarios.
To comprehend the subject of routing systems for earthquakes, it is crucial to involve subject matter experts in the design of such systems. These include urbanists, who analyze the earthquake impact on the city; UX designers, who assess user experience in utilizing mobile routing applications; quake survivors, who offer insights and experiences regarding human behavior and safety during earthquakes; and first responders, who provide perspectives on delivering medical support and emergency rescue to civilians during seismic events. By collaborating with these subject matter experts, we can iteratively refine the design of the routing application, and modify algorithms that are apt for earthquake scenarios.
Method
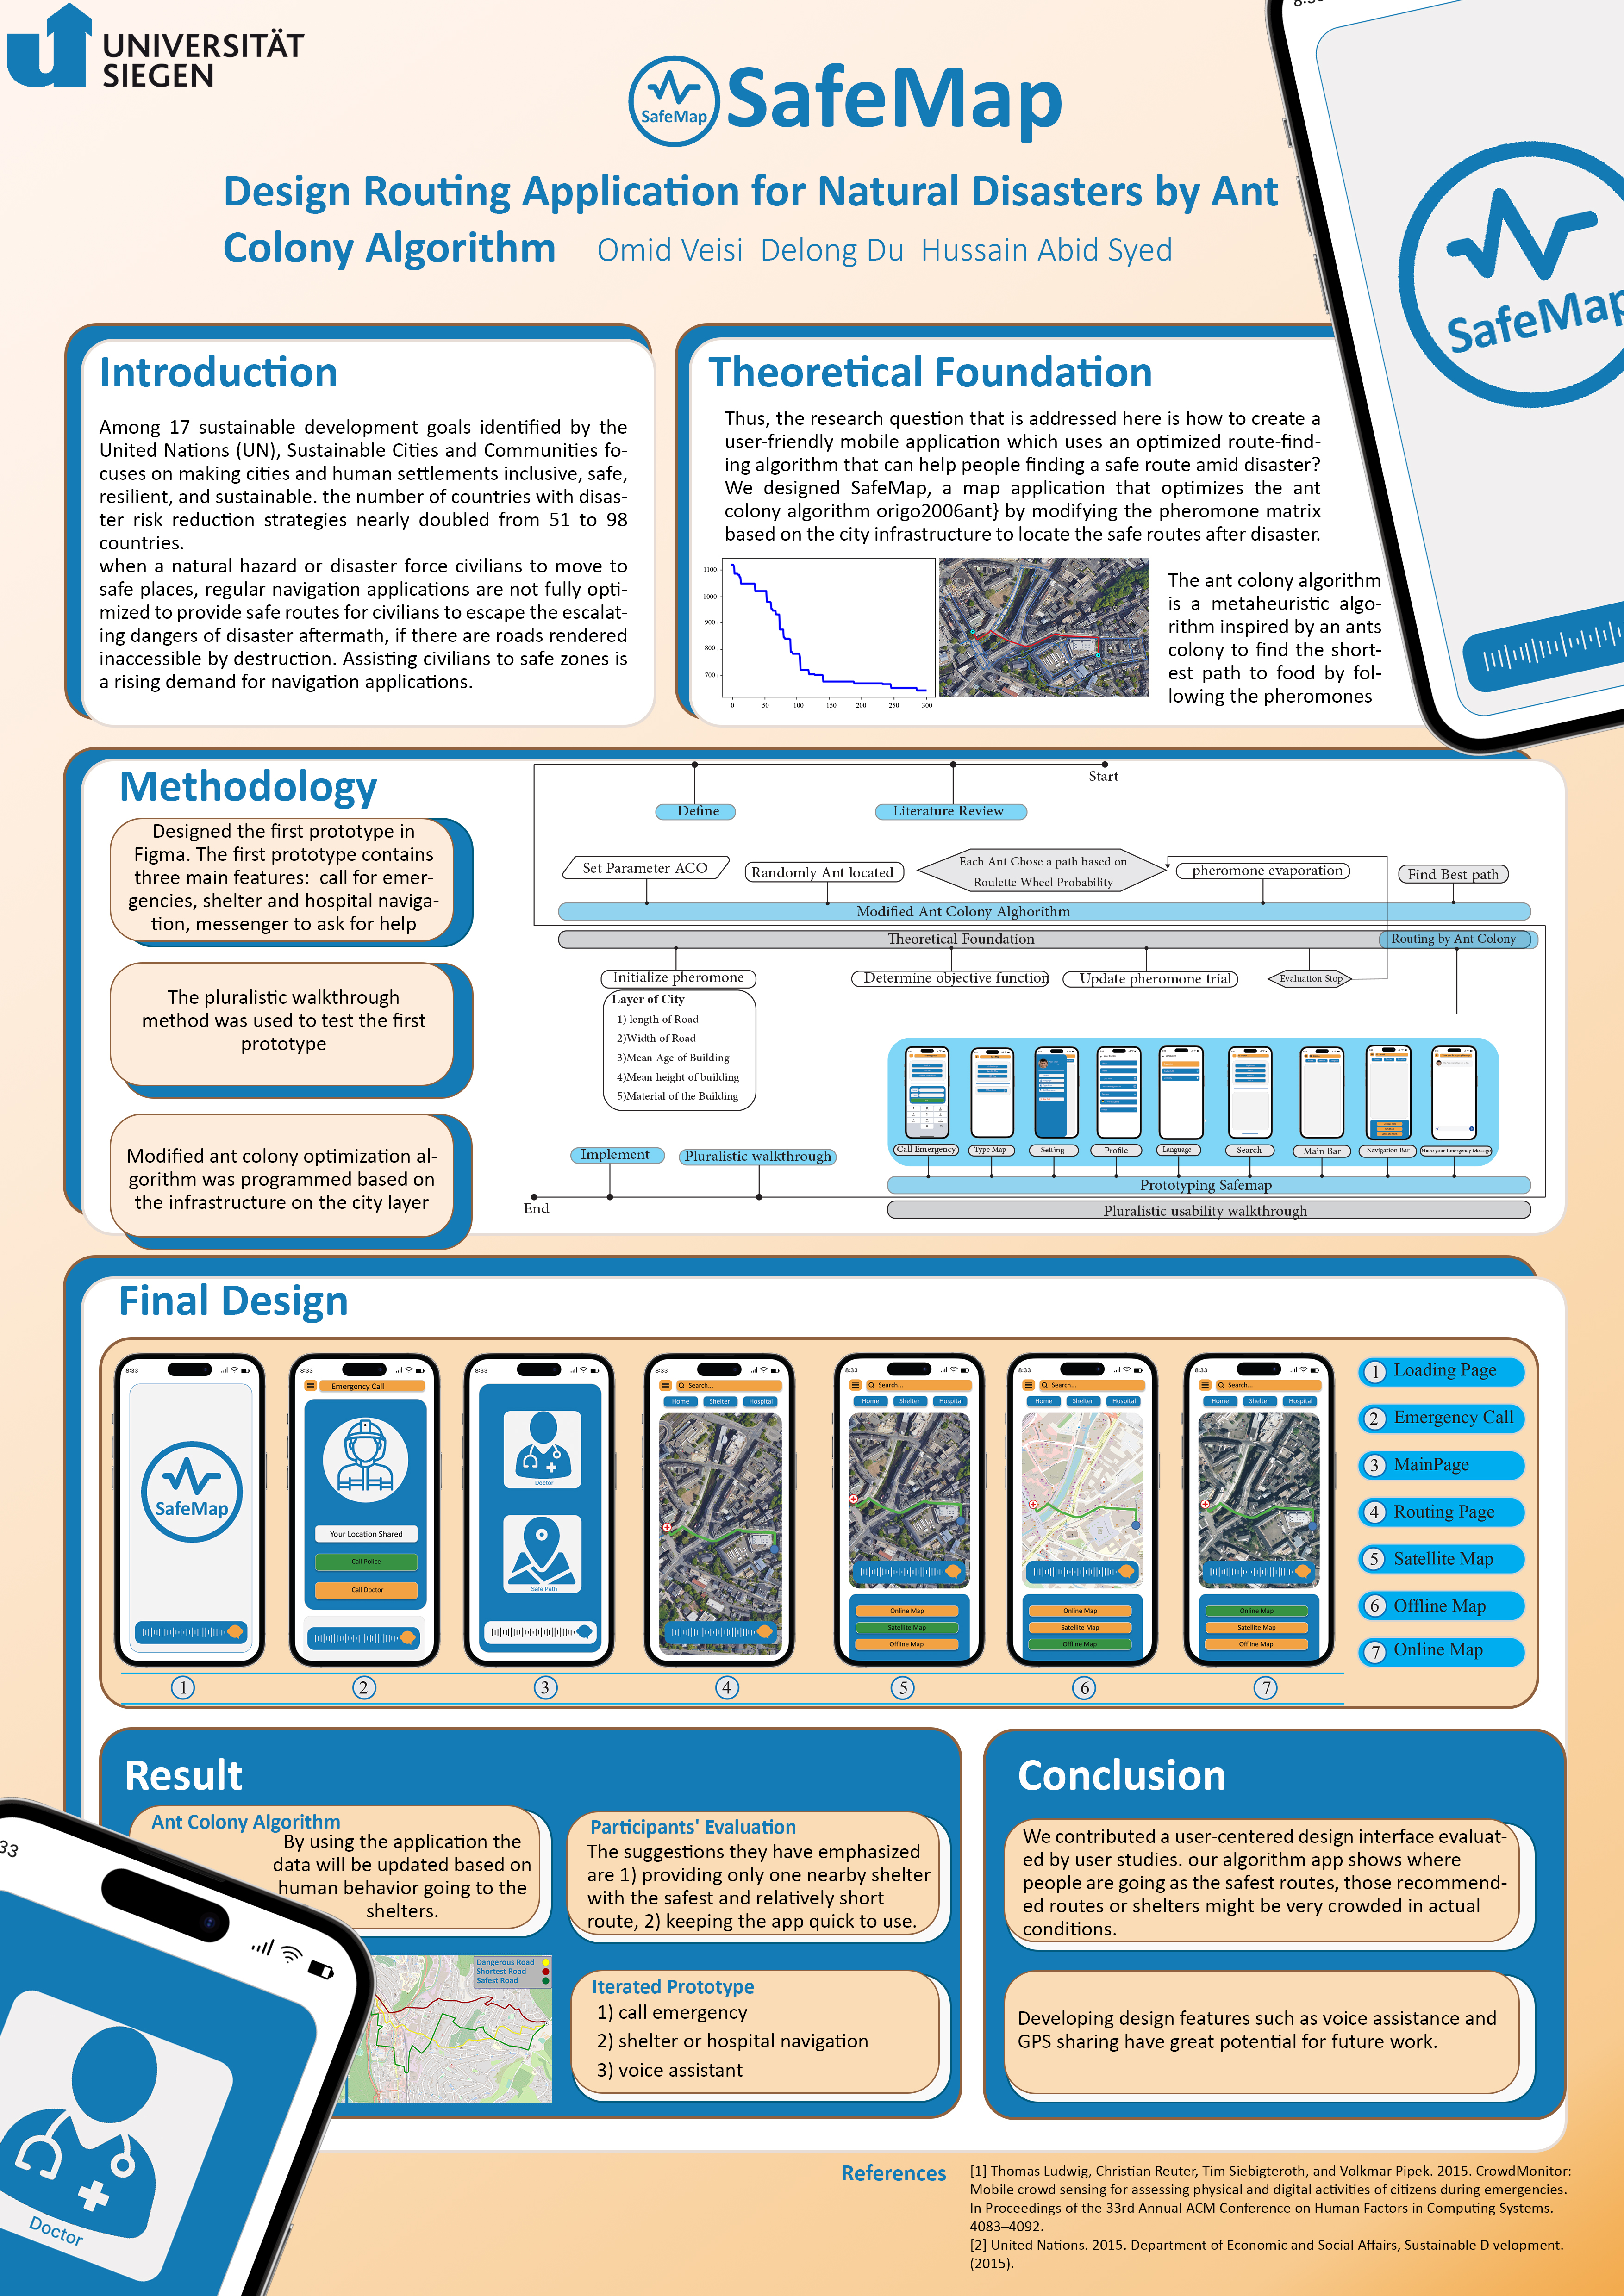
The methodology of this research paper is meticulously
structured to thoroughly delineate the development and
validation process of the proposed Modified A-Star Algorithm
for Routing in Earthquakes. This research endeavour employs a
multi-phased strategy, illustrated in Fig1 , and is anchored
in the principles of research through design.
The first phase of our research involved conducting an extensive pre-study and literature review, enriched by the insights of two professors specializing in urban planning. This foundational step was pivotal in contextualizing our work within the broader realms of urban planning and algorithmic routing. Subsequently, we crafted the inaugural prototype of the SafeMap application, incorporating a refined A-Star algorithm designed to integrate city infrastructure layers. In the event of an earthquake, this application aims to identify the most secure and efficient routes to designated shelters.
The second phrase encompassed user tests aimed at validating the effectiveness and usability of SafeMap. We employed the pluralistic walkthrough technique, engaging 34 participants from diverse areas of expertise, including 15 UX designers, 7 urbanists, 8 quake survivors, and 4 first responders. The invaluable insights provided by these participants were instrumental in refining the application through iterative prototyping. The evaluations concentrated on assessing the user experience, usability, and overall functionality of the system. This phase played a pivotal role in shaping the final design of the application, ensuring its alignment with user needs and experiences.
The third phase was dedicated to expert consultation and refinement of the algorithm across the four identified categories. Initially, collaboration with UX designers, quake survivors, and first responders facilitated the creation of an iterated prototype, grounded in our comprehensive evaluation and spectaculative design. Subsequently, our focus shifted to conducting interviews with professionals in Urbanist and planning, aiming to garner insights into urban resilience and planning. Moreover, engaging in dialogues with specialists allowed us to underscore key components identified by participants, especially those frequently mentioned by quake survivors and first responders. Suggestions for refining the algorithm were developed concurrently, encompassing proposals for compiling a comprehensive road-based dataset, assigning subsequent weights, and integrating safety-related criteria into the routing algorithm. This iterative methodology enabled SafeMap to evolve in alignment with user needs while accommodating the complexities of fluctuating urban landscapes.
To sum up, the research paper utilized a methodical and iterative approach that incorporated feedback from both experts and users to create a routing algorithm that is effective and user-friendly within the SafeMap app. The various phases, including initial algorithm development, consultations with experts, and continuous improvement, played a vital role in shaping the final design of the application. As a result, the app is now capable of testing its assistance to individuals in earthquake drills.
Fig 1. Research Framework to develop Safemap application
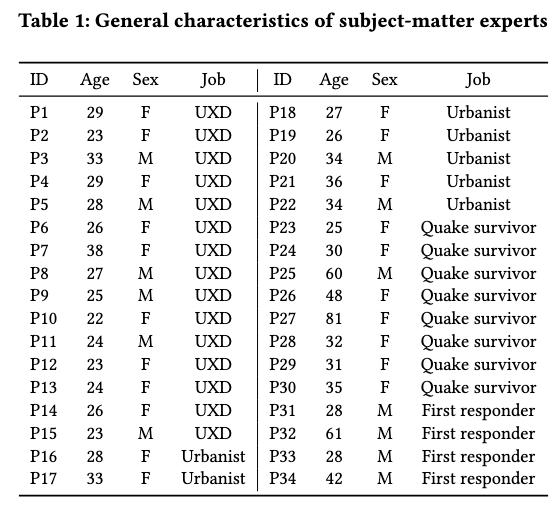
Subject-Matter Experts for Earthquake
Given the intricate interplay between humans and cities during
earthquakes, we recruited representatives from four categories
of subject-matter experts to assess and refine our design. These
experts comprised 15 UX Designers (UXD), 7 Urban Planners, 8
quake survivors, and 4 First Responders. Within simulated
earthquake scenarios, we engaged quake survivors to test our
app, UX designers to refine the app’s design, urban planners to
evaluate modifications to the algorithm, and first responders to
assess the app’s utility in earthquake rescue scenarios. This
multifaceted approach ensured a comprehensive evaluation and
refinement of the app, addressing the diverse needs and insights
arising from different perspectives and experiences related to
earthquake response and urban navigation. The subject-matter
experts are listed in Table 1.
Prototyping Urban AI Navigation Application For Earthquakes
The initial prototype was designed using Figma and encompasses
three principal features: 1) a call function for emergencies,
facilitating contact with first responders services for
medicinal and rescue supports; 2) navigation to shelters and
hospitals; and 3) a messenger feature to request assistance.
In the process of creating the mock-up for nearby shelters, we
utilized Google Maps to search for "shelters near our
researched location." However, the search yielded no results
for our specified location, prompting us to search for
hospitals instead. This scenario exemplifies the limitations
of conventional navigation applications like Google Maps in
providing assistance during earthquake situations.
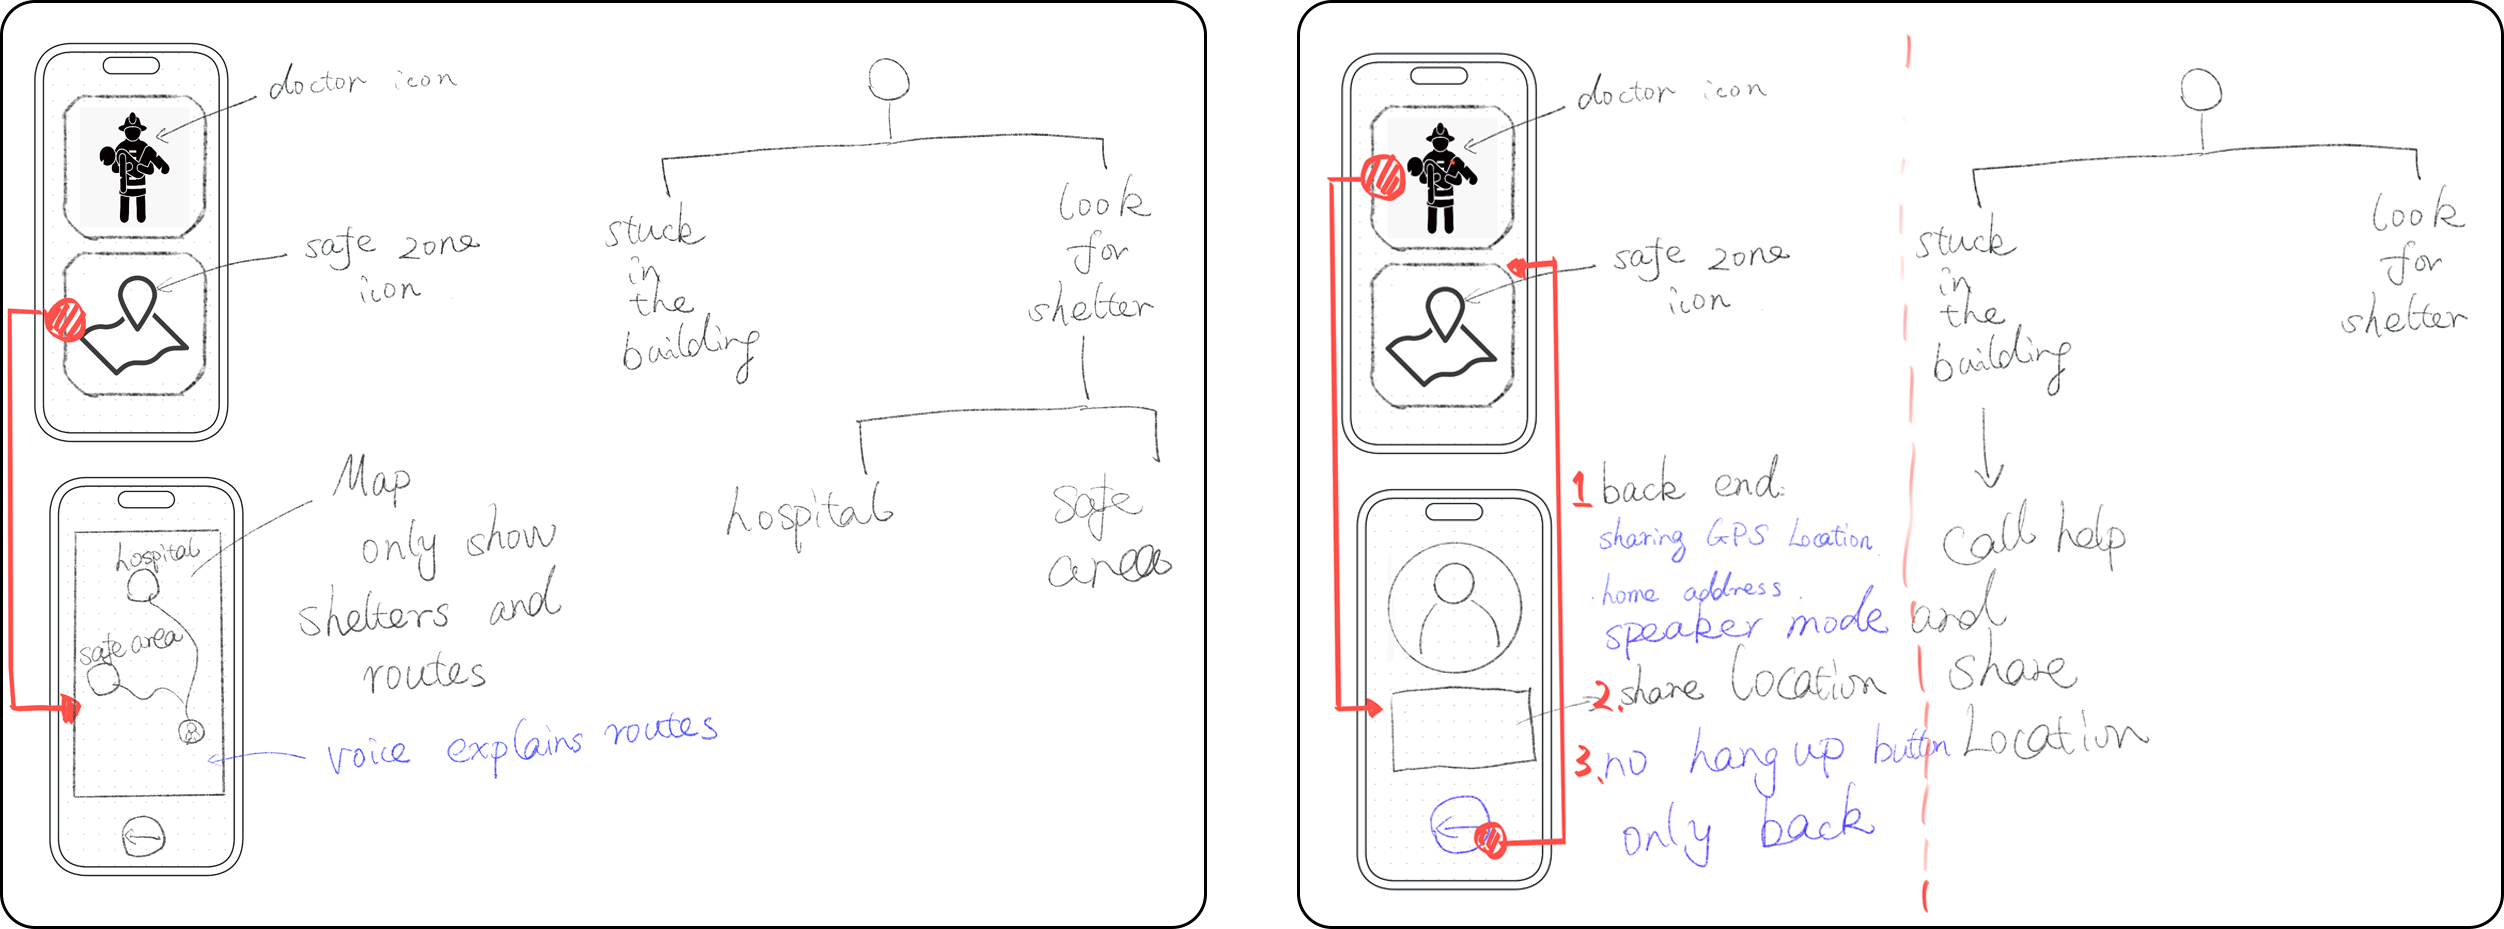
Fig 2. Wire framing for prototyping version
To ensure a comprehensive evaluation and refinement of the
application, a multifaceted approach was employed, involving
representatives from four categories of subject-matter
experts: UX Designers, urbanists, quake survivors, and first
responders. The appropriation phase involved semi-structured
interviews and observation methods to gain insights into the
user's interaction with the system. During the observation
sessions, videos capturing user interactions, the screen of
the primary Android tablet, and the interviewer's voice were
recorded. This method allowed for a detailed examination of
the interaction between the users and the system, enabling the
identification and understanding of user complaints and the
reasons behind them. The usability test approach was grounded
in the Think-Aloud Protocol technique of usability testing
\cite{van1994think}. Participants were required to vocalize
their cognitive processes while interacting with the program,
accomplishing specific activities designed to assess various
aspects of the application. Researchers provided prompts and
questions to encourage participants to verbalize their
thoughts and feedback on the system continuously. The
activities were presented in print or on a laptop, and
participants were encouraged to express their opinions
verbally as they navigated through them. Researchers monitored
the sessions closely, intervening as necessary to address
technical difficulties and ensure the progression of the test.
Participants were allowed to explore the program freely, with
no imposed order of completing activities, allowing for an
intuitive interaction with the system. This meticulous process
of appropriation and evaluation, involving diverse
subject-matter experts, was pivotal in enhancing the app's
usability and effectiveness in real-world earthquake response
and urban navigation scenarios.
During the study, the facilitator presents participants with the user interface images and asks participants to think aloud about what interaction they would do to achieve specific tasks. After the participants have given their answers on how they would perform the interaction to achieve their tasks, the facilitators provide further information to participants to invite discussion. In order to gather user data to test our algorithm and this first prototype, we collected users' preferences on path choices. We edited three routes in Google Maps to ask our participants which path they would choose. Each route has different safety levels, shown as red, yellow, and green. Green is the safest. We gathered data about 1) participants' path choice before and after additional information about city infrastructures affected by hazards, 2) heuristic strategy about participants' judgment on what they consider safe to reflect on city infrastructures, and 3) participants' suggestions for prototype iteration. During the Pluralistic walkthrough, a set of questions were answered by participants.
During the study, the facilitator presents participants with the user interface images and asks participants to think aloud about what interaction they would do to achieve specific tasks. After the participants have given their answers on how they would perform the interaction to achieve their tasks, the facilitators provide further information to participants to invite discussion. In order to gather user data to test our algorithm and this first prototype, we collected users' preferences on path choices. We edited three routes in Google Maps to ask our participants which path they would choose. Each route has different safety levels, shown as red, yellow, and green. Green is the safest. We gathered data about 1) participants' path choice before and after additional information about city infrastructures affected by hazards, 2) heuristic strategy about participants' judgment on what they consider safe to reflect on city infrastructures, and 3) participants' suggestions for prototype iteration. During the Pluralistic walkthrough, a set of questions were answered by participants.
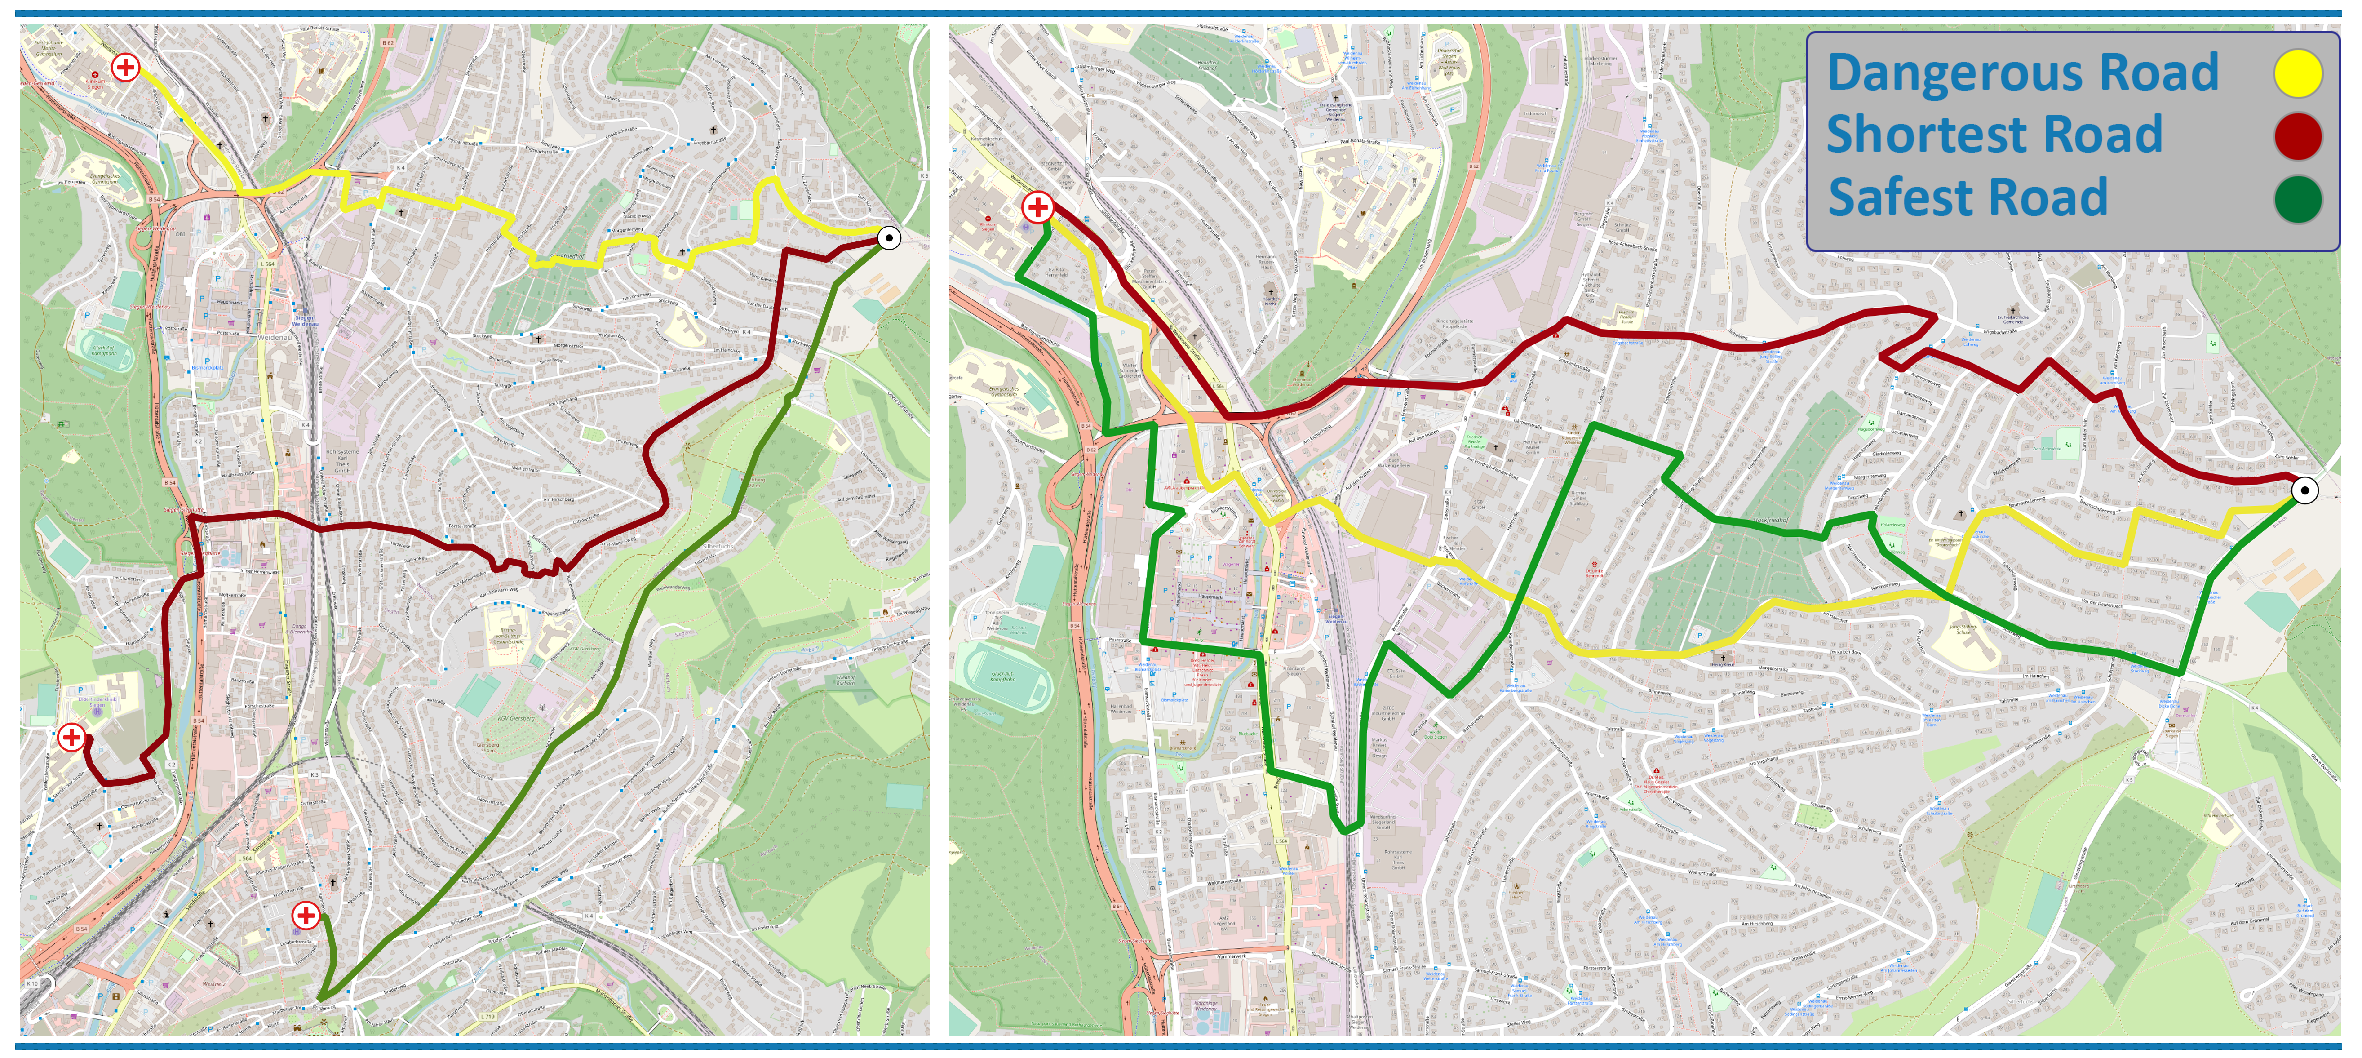
Fig 3. Wire framing for prototyping version
Our primary findings are categorized into two main components:
User Experience Design and Algorithm Modification.
The first component, User Experience Design, involves insights related to the design of the navigation user interface. It emphasizes the imperative nature of ensuring the rapid usability of the earthquake navigation app, a crucial element given the heightened tension and time sensitivity users experience during an earthquake. The prompt usability of the app is pivotal to guarantee that the app’s response and feedback are immediate and efficient, necessitating a design free of complicated operations. Additionally, our expert user research reveals a cautious view regarding the integration of augmented reality and voice assistant technologies during earthquakes, due to the limited field of view and over-immersion, making users becomes engrossed in the digital interaction and distracted from real world condition. This skepticism stems from the understanding that, in high-pressure scenarios, the operation of these systems could potentially extend the user’s interaction time with the app. The implications of our user research suggest a significant need to minimize technological disruptions for users of an earthquake navigation app. This is crucial as any delay, such as waiting for AR to initialize or adjusting the volume to hear voice assistant instructions, can escalate psychological stress for users, especially in life-threatening situations during an earthquake.
Iterated Prototype
The first component, User Experience Design, involves insights related to the design of the navigation user interface. It emphasizes the imperative nature of ensuring the rapid usability of the earthquake navigation app, a crucial element given the heightened tension and time sensitivity users experience during an earthquake. The prompt usability of the app is pivotal to guarantee that the app’s response and feedback are immediate and efficient, necessitating a design free of complicated operations. Additionally, our expert user research reveals a cautious view regarding the integration of augmented reality and voice assistant technologies during earthquakes, due to the limited field of view and over-immersion, making users becomes engrossed in the digital interaction and distracted from real world condition. This skepticism stems from the understanding that, in high-pressure scenarios, the operation of these systems could potentially extend the user’s interaction time with the app. The implications of our user research suggest a significant need to minimize technological disruptions for users of an earthquake navigation app. This is crucial as any delay, such as waiting for AR to initialize or adjusting the volume to hear voice assistant instructions, can escalate psychological stress for users, especially in life-threatening situations during an earthquake.
In the iteration, quake survivors suggested reducing the
cognitive load to use our app in a stressful crisis condition.
The interviews have helped us to empathize with users' minds as
we repeated the design thinking process to iterate our
prototype. Based on our users' evaluation, we kept two main
features 1) call emergency, and 2) shelter or hospital
navigation. Our iterated prototype is shown in Fig 2. If users
are trapped in the building, the app will provide a button to
call for rescue and should automatically share users' locations.
Our application should also provide information on users'
current addresses, in case the GPS location needs to be verbally
reported to the rescue facility. If users just escaped from the
building, and want to look for a nearby safe place, the app will
provide navigation to both hospitals and shelters nearby with
only one safest route with a relatively short path.
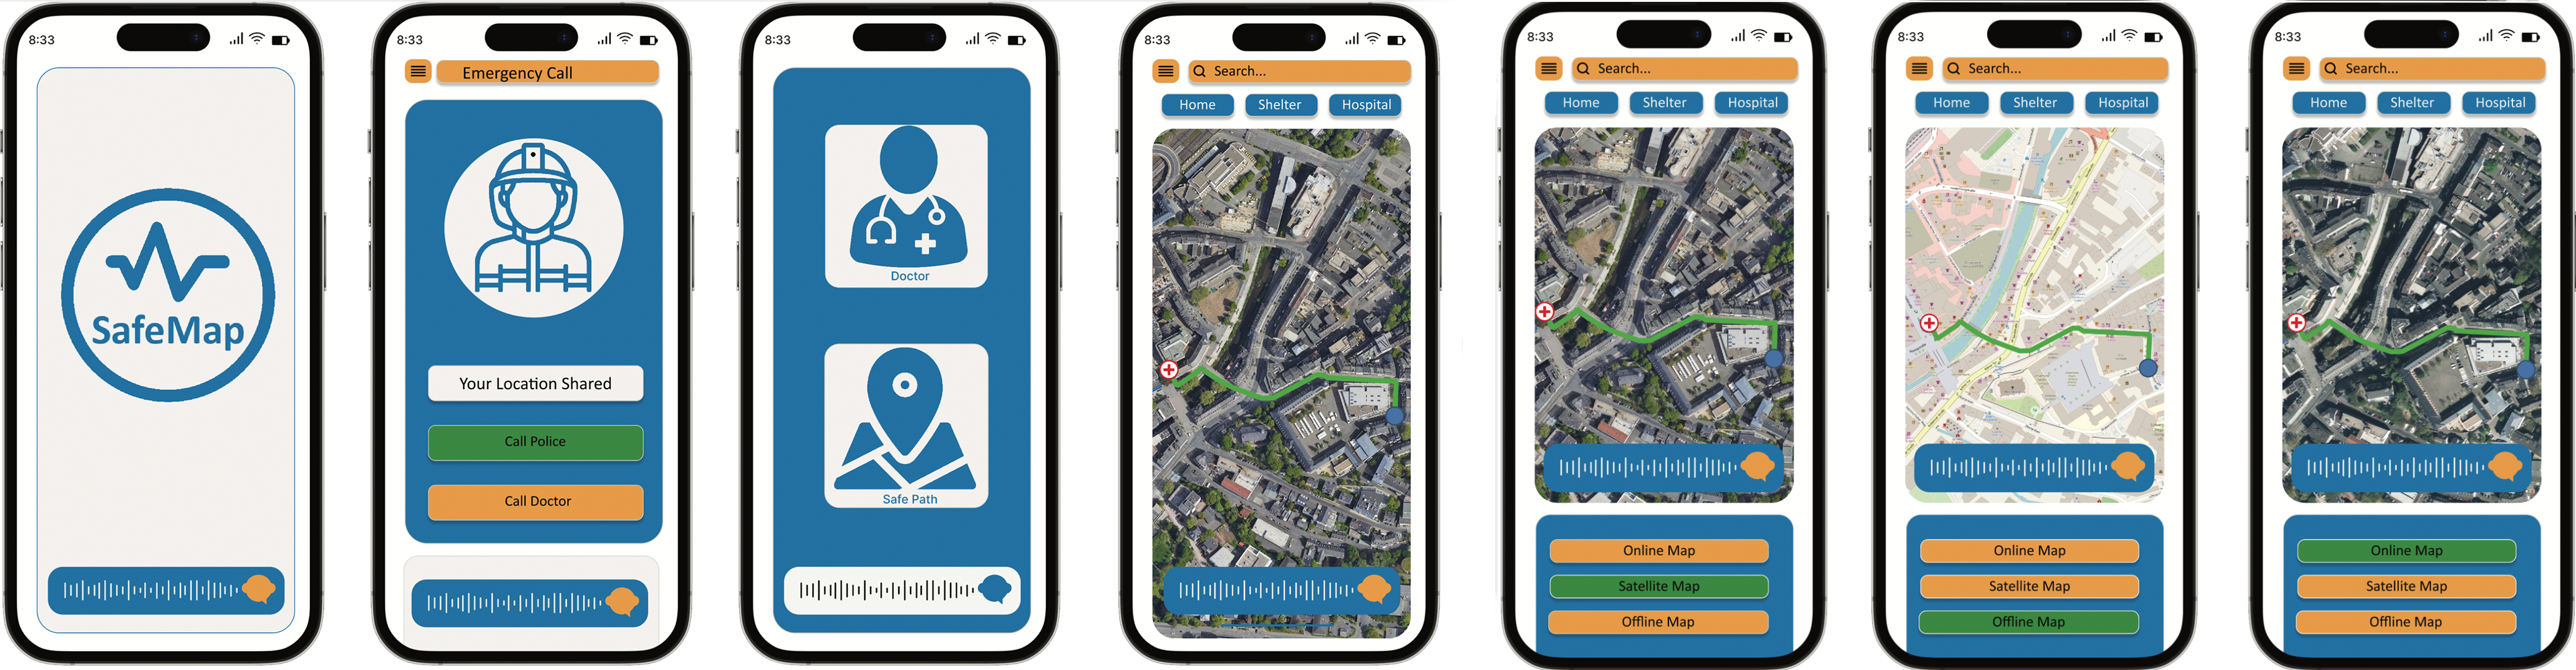

Fig 4 & 5. Iterated Prototype
The second component, Algorithm Modification, discusses
alterations made to the algorithm. We posit that the
superiority of the A-Star algorithm over other routing
algorithms is its capability to execute swiftly, its minimal
reliance on extensive CPU power, and its ability to function
locally in scenarios where the internet is unavailable, a
common occurrence during earthquakes due to network
disruptions. Furthermore, we have enhanced the algorithm by
incorporating considerations of city layers and
infrastructure. We have also integrated concepts from the
ant colony algorithm, acknowledging the human inclination to
seek safe zones, thereby imbuing the A-Star algorithm with
this capability. The enhancements to the A-Star algorithm
are segmented into four steps: 1) creating a dataset based
on roads; 2) establishing an empty dataset for weight; 3)
enabling the updating of weight contingent on
infrastructure; and 4) permitting the modification of weight
based on safety, correlated to human behavior. Subsequent
sections will delve into the detailed process of these
specific algorithmic improvements.
Modification on A-Star algorithm
The shortest route has been intensively investigated in
computer science in path-finding issues owing to its broad
applications such as network routing protocols, traffic
management, and transportation systems
\cite{stern2019multi}. A-Star search method, Dijkstra, and
Ant Colony Optimization are been studied among all other
algorithms documented in the literature that address the
shortest route between two geographical places. While
Dijkstra obtains the best answer by investigating all
potential pathways, A-Star search utilizes a heuristic
function to determine the shortest path. A-Star is a BFS
algorithm that uses a heuristic function to find the
shortest path from a source node to a destination node in
a grid.
This research presents an efficient algorithm based on A-Star search to find the safest route dynamically between two locations. Safety and infrastructure data are integrated into a graph representation of the environment. Adaptive thresholds are used to filter out hazardous routes. A-star search guided by a cost function combining safety and appearance scores can rapidly find optimal routes. The algorithm is extended to work in real time by continuously updating the graph with simulated live data and re-running route searches to deal with dynamic changes. The algorithm is implemented in four steps:
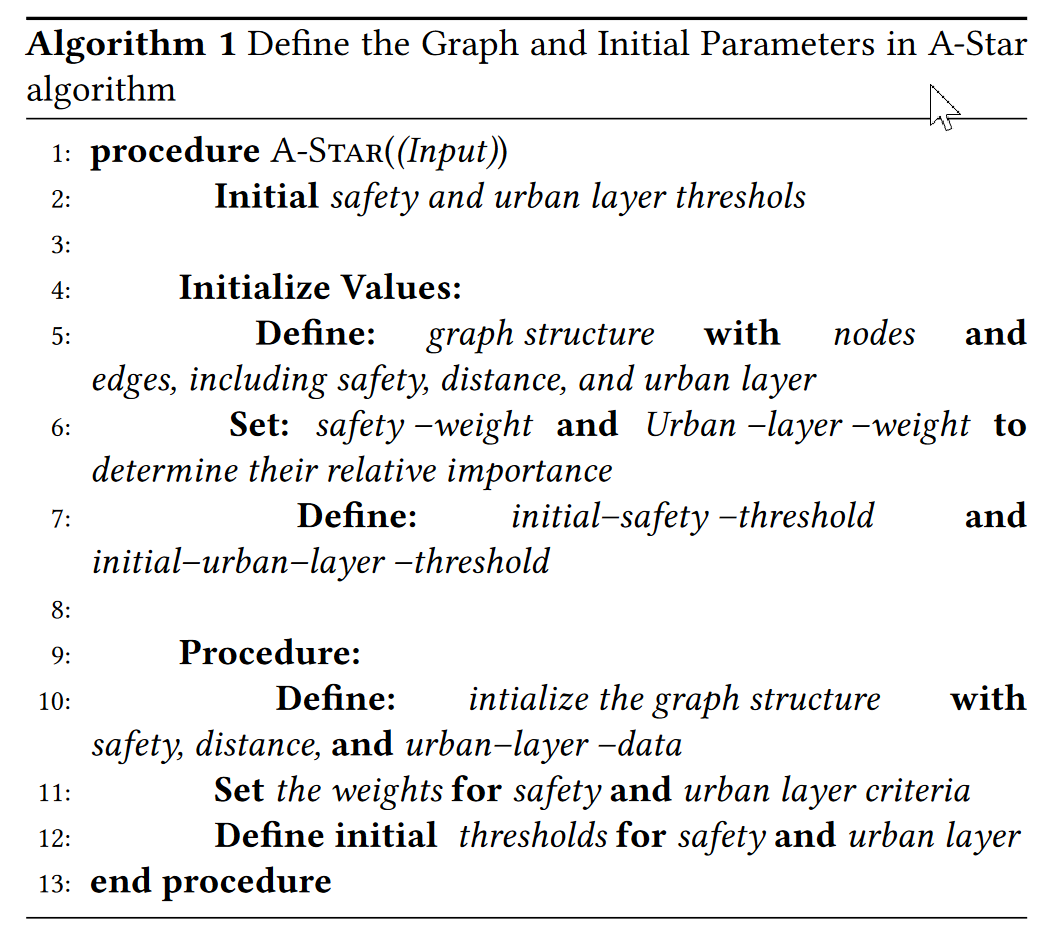
In the first step, we initialize the data structure of the graph that shows the city centers and the connections (the edges) between them. Each edge in the chart contains information about safety, distance, and urban layers. Safety_Weight and urban\textendash layer_Weight are defined to assign different weights to safety and infrastructure criteria. These weights determine the relative importance of each criterion in the optimization process. These thresholds determine whether a road is considered safe or has enough infrastructure to choose the route as a safe path (Algorithm 1).
Here, we set up a route\textendash cache dictionary. This cache is used to store calculated routes and their associated safety and infrastructure thresholds. It helps to avoid extra calculations by checking if a path has already been calculated (Algorithm 2).
This is the core of the code, the A-Star algorithm. It is responsible for finding the safest route by taking into account the safety and appearance criteria. The algorithm checks whether the route from start to target is calculated with the safety and apparent thresholds given before using the route\textendash cache. If the cache is cached, it retrieves the path from the cache to avoid recomputing. The algorithm maintains a priority queue (open\textendash set) to explore the path efficiently. It calculates a dynamic safety threshold (dynamic\textendash safety\textendash threshold) and appearance threshold (dynamic\textendash urbanlayer\textendash threshold) based on current conditions. The safety and infrastructure threshold are used to determine whether a road is suitable for being on track. The algorithm selects a path with the highest safety and infrastructure stability while minimizing the overall cost (taking into account both safety weight and infrastructure weight). Once the safest route is found, it is stored in the route\textendash cache to avoid additional calculations. This step consists primarily of the A-Star customized algorithm according to the demands of the research which includes several mathematical components.

 First of all, the heuristic function estimates the cost
from the current node to the target node using Euclidean
distance or a similar metric. Second, dynamic thresholds
are calculated based on current conditions. These
thresholds can be defined based on specific criteria or
conditions, depending on the scope of the problem. Third,
cost calculations or Probation cost (tentative\textendash
g\textendash cost) for each neighboring node is calculated
based on the cost of the current node, the distance to the
neighbor and the domain-specific factors. The combined
cost (f\textendash cost) is calculated as the weighted sum
of safety and infrastructure scores.
First of all, the heuristic function estimates the cost
from the current node to the target node using Euclidean
distance or a similar metric. Second, dynamic thresholds
are calculated based on current conditions. These
thresholds can be defined based on specific criteria or
conditions, depending on the scope of the problem. Third,
cost calculations or Probation cost (tentative\textendash
g\textendash cost) for each neighboring node is calculated
based on the cost of the current node, the distance to the
neighbor and the domain-specific factors. The combined
cost (f\textendash cost) is calculated as the weighted sum
of safety and infrastructure scores.
Safety_weight are user_defined weights that reflect the relative importance of safety and infrastructure metrics. These weights can be adjusted based on the needs of the problem. Safety and infrastructure represent safety scores and the infrastructure associated with the edge being considered (Algorithm 3).
This step defines the function calculate route\textendash features which calculates the level of safety, total distance, and overall infrastructure of a given path. Through each edge (road) in the path it repeats, retrieves the safety data, distance, and infrastructure from the graph, and sums up values. The function returns a dictionary containing these trajectory properties. In this step, the safety level of a route is calculated as the product of the safety score along the path. For each edge on the path, the safety score is multiplied.
\text{Safety level} = \prod_{i=1}^{n} \text{Safety score}_{i}
Safety Score i indicates the safety score associated with edge i on the route. n is the total number of route edges. Also, the total distance of the route is the sum of distances of all edges in the path which is calculated by the formula below. In this formula, n is the total number of route edges, and distance i indicates the distance associated with edge i on the route.
Safety Level = \prod_{i=1}^{n} \text{Safety Score}_{i}
The infrastructure score(urban layer) is the sum of apparent points for all edges of the path. The i infrastructure represents the apparent score associated with edge i in the route. And n The total number of edges in the route.
\text{Total Appearance} = \sum_{i=1}^{n} \text{infrastructure}_{i}
Finally, these steps together enable the code to continuously update safety and infrastructure data, apply the A-Star algorithm with customizations, and calculate and display track properties in real time. This code ensures efficient route optimization while considering dynamic thresholds and minimizing redundant computations (Algorithm 4).
This research presents an efficient algorithm based on A-Star search to find the safest route dynamically between two locations. Safety and infrastructure data are integrated into a graph representation of the environment. Adaptive thresholds are used to filter out hazardous routes. A-star search guided by a cost function combining safety and appearance scores can rapidly find optimal routes. The algorithm is extended to work in real time by continuously updating the graph with simulated live data and re-running route searches to deal with dynamic changes. The algorithm is implemented in four steps:
In the first step, we initialize the data structure of the graph that shows the city centers and the connections (the edges) between them. Each edge in the chart contains information about safety, distance, and urban layers. Safety_Weight and urban\textendash layer_Weight are defined to assign different weights to safety and infrastructure criteria. These weights determine the relative importance of each criterion in the optimization process. These thresholds determine whether a road is considered safe or has enough infrastructure to choose the route as a safe path (Algorithm 1).
Here, we set up a route\textendash cache dictionary. This cache is used to store calculated routes and their associated safety and infrastructure thresholds. It helps to avoid extra calculations by checking if a path has already been calculated (Algorithm 2).
This is the core of the code, the A-Star algorithm. It is responsible for finding the safest route by taking into account the safety and appearance criteria. The algorithm checks whether the route from start to target is calculated with the safety and apparent thresholds given before using the route\textendash cache. If the cache is cached, it retrieves the path from the cache to avoid recomputing. The algorithm maintains a priority queue (open\textendash set) to explore the path efficiently. It calculates a dynamic safety threshold (dynamic\textendash safety\textendash threshold) and appearance threshold (dynamic\textendash urbanlayer\textendash threshold) based on current conditions. The safety and infrastructure threshold are used to determine whether a road is suitable for being on track. The algorithm selects a path with the highest safety and infrastructure stability while minimizing the overall cost (taking into account both safety weight and infrastructure weight). Once the safest route is found, it is stored in the route\textendash cache to avoid additional calculations. This step consists primarily of the A-Star customized algorithm according to the demands of the research which includes several mathematical components.
Safety_weight are user_defined weights that reflect the relative importance of safety and infrastructure metrics. These weights can be adjusted based on the needs of the problem. Safety and infrastructure represent safety scores and the infrastructure associated with the edge being considered (Algorithm 3).
This step defines the function calculate route\textendash features which calculates the level of safety, total distance, and overall infrastructure of a given path. Through each edge (road) in the path it repeats, retrieves the safety data, distance, and infrastructure from the graph, and sums up values. The function returns a dictionary containing these trajectory properties. In this step, the safety level of a route is calculated as the product of the safety score along the path. For each edge on the path, the safety score is multiplied.
\text{Safety level} = \prod_{i=1}^{n} \text{Safety score}_{i}
Safety Score i indicates the safety score associated with edge i on the route. n is the total number of route edges. Also, the total distance of the route is the sum of distances of all edges in the path which is calculated by the formula below. In this formula, n is the total number of route edges, and distance i indicates the distance associated with edge i on the route.
Safety Level = \prod_{i=1}^{n} \text{Safety Score}_{i}
The infrastructure score(urban layer) is the sum of apparent points for all edges of the path. The i infrastructure represents the apparent score associated with edge i in the route. And n The total number of edges in the route.
\text{Total Appearance} = \sum_{i=1}^{n} \text{infrastructure}_{i}
Finally, these steps together enable the code to continuously update safety and infrastructure data, apply the A-Star algorithm with customizations, and calculate and display track properties in real time. This code ensures efficient route optimization while considering dynamic thresholds and minimizing redundant computations (Algorithm 4).

Video Presentation
Video presentation